
1. Experimental materials
The tensile test piece is sampled from the material, and the size is determined according to GB/T 228.1-2010 "Tensile Testing of Metallic Materials Part 1: Room Temperature Test Method" [8], as shown in Figure 1. The length of the specimen is 300mm. Three identical composite ratios were designed, numbered TB-1, TB-2, and TB-3. The thickness of the steel base layer was 10mm, and the thickness of the titanium layer was 2mm. The size design of the specimen is shown in Figure 2. The cut and formed specimen is shown in Figure 3.
The distribution of titanium layer and low-carbon steel layer can be clearly seen from the material organization diagram of the cross-section of the plate in Figure 4.

Figure 2 Design drawing of specimen size


Figure 3 Cutting and Forming Diagram of Test Piece Figure 4 Cross sectional Material Organization Chart of Test Piece
TA2+Q235B explosive titanium steel composite plate, with industrial pure titanium cladding
TA2, The thickness is 2mm, and the base layer is made of Q235B steel with a thickness of 11mm. Table 1 shows the mechanical performance indicators of TA2 and Q235B.
According to GB/T 228.1-2010 [8], wire cut TA2+Q235B composite plate tensile specimens. The tensile test was conducted on a microcomputer servo hydraulic universal testing machine, and the single point fatigue test was conducted on an MTS810 fatigue testing machine. Five stresses were selected in sequence: 0.5rm, 0.45rm, 0.4rm, 0.35rm, and 0.3rm. The stress levels were gradually reduced during the test, with a sine wave frequency of 30Hz, a stress ratio of -1, and a loading frequency of 2 × 10⁵ times. The microstructure of the interface of titanium steel composite plate was analyzed and observed using a Zeiss Axiovert 200MAT metallographic microscope.
2. Experimental process
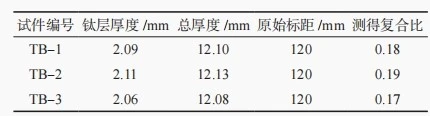
At the beginning of loading, as the load increases, the specimen is slightly elongated and the cross-section shows signs of shrinkage. As the load further increases, the deformation of the specimen increases. When loaded to the maximum value, the specimen exhibited necking and eventually broke. During the experiment, there were two sounds accompanied by the specimen from the beginning of loading to failure. The first was the separation of the titanium steel interface, and the second was the fracture of the specimen. It can be seen that the base and cladding of titanium steel composite plates can work together during the tensile process. The measured data of each specimen are shown in Table 2. It is worth noting that the fracture shapes of all specimens are similar, and there is bending deformation accompanied by tension, which is due to the release of residual stress in the plate. At the same time, microscopic analysis of TA2+Q235B steel shows that the microscopic appearance on both sides of the layer is similar, indicating that the two metal materials have good connectivity in terms of bonding.
When the strain is below 8%, the slope of the curve tends to flatten
Slow and obvious yielding deformation. Meanwhile, as the strain load ratio of the steel increases, the deformation capacity gradually decreases, which is due to the decrease in the proportion of titanium in tension. Through measurement, it was found that the length of the specimen increased, first in the middle, and then gradually spread to both ends. The strain of the base layer and the composite layer was the same, indicating that they underwent coordinated deformation. From the measurement results, it can also be seen that the deformation in the middle of the specimen is the largest, and the deformation at the cross-section is uniform, indicating the coordinated deformation of the base layer and the composite layer. When the material is stretched and fractured, it moves along the dislocation slip plane, and the precipitate crystals appear discontinuous dislocation plugs. During the experiment, stress concentration occurred due to the presence of pores in weak areas. As the shear stress increased, the pores gathered and eventually necked, leading to fracture. Through substrate and the micro tensile diagram of the composite material shows obvious toughness characteristics at the fracture surface, with a certain number of elliptical or circular pits of varying sizes on the surface, unevenly distributed in size, indicating that the material underwent significant plastic deformation before fracture.


